Plots in Windows are always heavily aliased #2142
Comments
|
@jackbrookes I agree with you about the default on Windows, and how much better it looks with Cairo. We'll consider your enhancement request to add an option for |
|
I'm putting this into the v1.3 milestone for consideration (this will become more important especially as high DPI displays become more common on Windows machines as well) |
|
Here's a hacky way to force RStudio to make anti-aliased plots on Windows: You can change |
Thanks for looking into it further. The fix works for me within a regular R script but not within a R Notebook (Rmd) file. Error: Tracing function "png" in package "grDevices (not-exported)" Running latest version of R and latest stable R Studio on Win 10. Current workaround is to render notebooks on a MacOS machine before sharing with others. |
For Rmd files adding this to your setup chunk should fix the issue: |
Thanks a lot! Works for me in the plot window, but not in the zoom window - does that use a different device? |
Awesome, thanks! I've also been disappointed / frustrated at the sucky graphics on Windows vs. Mac (at least in the "live" plots in RStudio - I know they can be just as beautiful when saved as PNG etc.). Could you (or someone) explain what this code does? It's brilliant and just what I've been looking for! I'm guessing it takes the graphics as input and spits out an anti-aliased PNG in the plots panel? (I've found Cairo mentioned before, but not used the "missing" or "trace" functions. |
Thank you, that's awesome! Any way to make this a default setting, instead of running the code every session? |
|
You could set it in your .Rprofile. |
|
@kevinushey This hack is so useful that it even solved a longstanding issue of @ishisht If it does not work for the zoom window, then modify the code as below: trace(grDevices::png, quote({
if (missing(type) && missing(antialias)) {
type <- "cairo-png"
antialias <- "subpixel"
}
}), print = FALSE)The tiny difference is that you now trace the exported function |
|
@jackbrookes , thanks again for finding and reporting this issue. We now have a fix in place in our latest 1.4 daily build. If you get the chance will you let us know if the issue is resolved for you in that build? |
Unfortunately, the latest build did not change anything for me. Here is a screenshot of the
And even the saved file has the same issue:
|


|
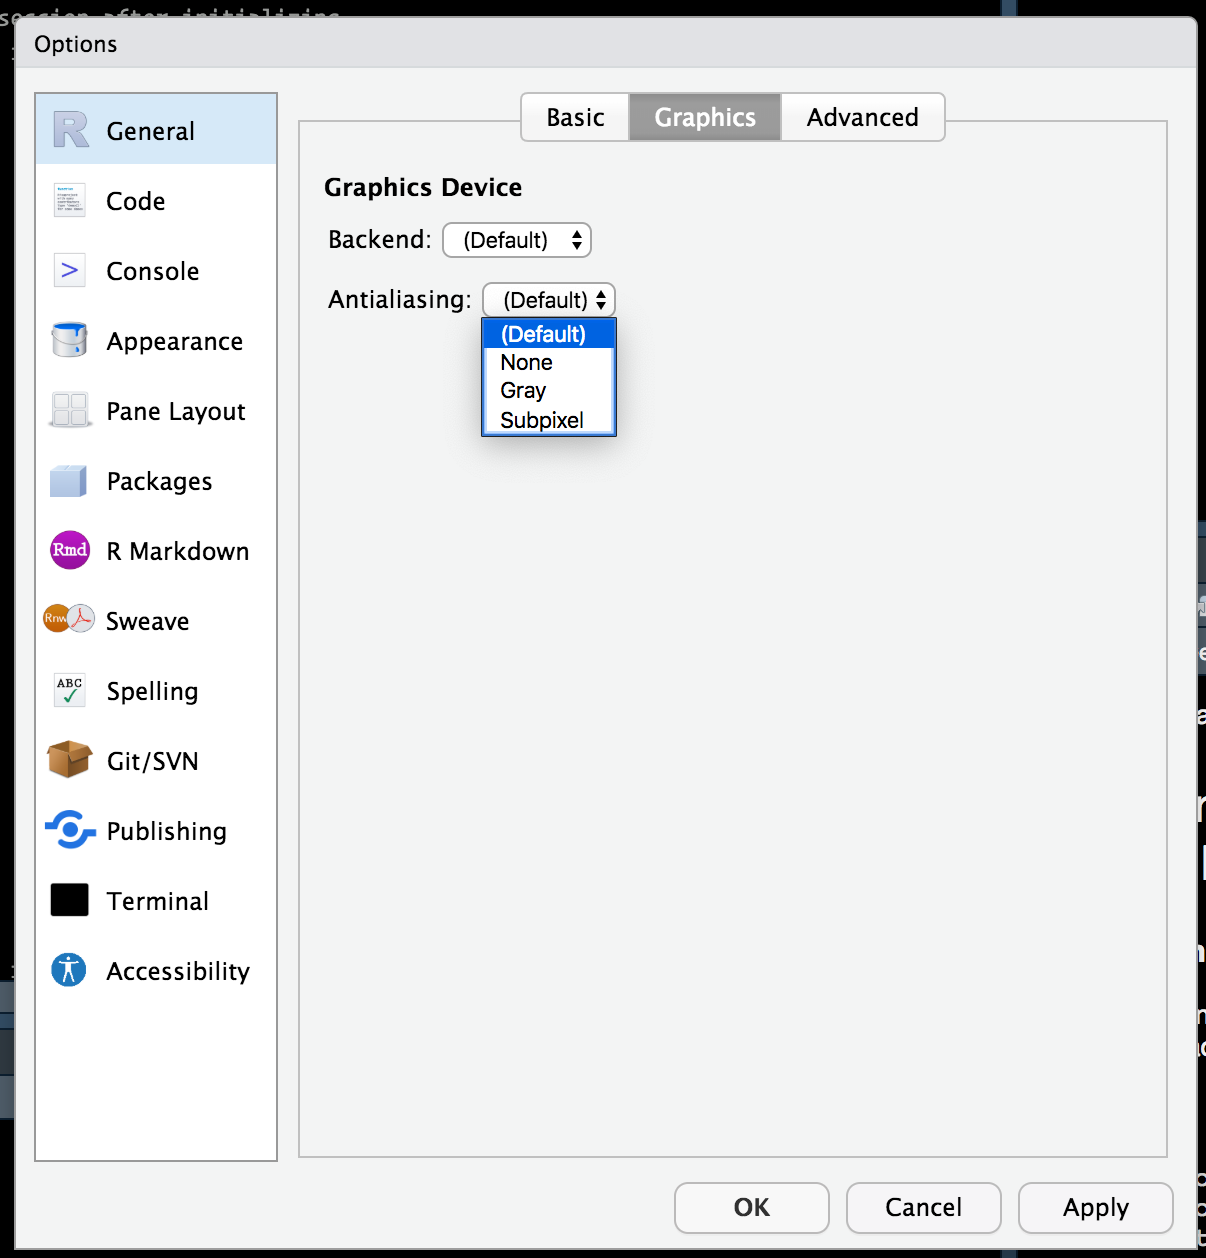
Does it make a difference if you alter the graphics device settings (Tools - > Global Options... -> General -> Graphics)?
|
|
Kind of, I can get good looking plot in the plots window if I set |
|
@kevinushey it seems like this is still an issue in some cases, should it be reopened? |
|
I've re-opened the issue, but moved out of 1.4 as I don't think we can apply any further fixes in time for this release. |
|
When I use the following code in an R Notebook, my lines look better, but the fill of shapes/ribbons is still heavily aliased (and using three colons instead of two did not work): Here's are a few examples of output:
|


|
In RMarkdown documents, adding this to a setup block fixes it for me: However this issue is around fixing this by default in Windows |
As described here and here, the suggestion to use |
|
Hi, as the changelog said: Thanks! |
|
You can set the R option For example, to use in (say) your R installation's |
|
Setting this in |
You can do this by creating a global user preference file, e.g., {
graphics_backend: "ragg"
} |
|
@jmcphers Is this also possible for non-pro versions of the server? EDIT: Yes, is is also working on non-pro servers ;) |
|
Yes, it does work for both! |
|
What ended up working for me was this command: |
Just noting that you'll likely get a JSON parsing error with the above so it needs to be valid JSON, e.g.: |
Default plots in WIndows have terrible aliasing. This can be fixed by using
type = "cairo"when saving with (e.g.)ggsave. However, the Plots pane in RStudio doesn't use this option. Often it is convenient to save plots directly from the editor but this leads to ugly plots, especially when using small points or thin lines.(Notice, in particular, jagged red line when zoomed in on normal plot)
This could be solved by having an option for
cairorendering in RStudio or makingcairothe default.The text was updated successfully, but these errors were encountered: