Feel free to create PR for additional Zabbix dashboards.
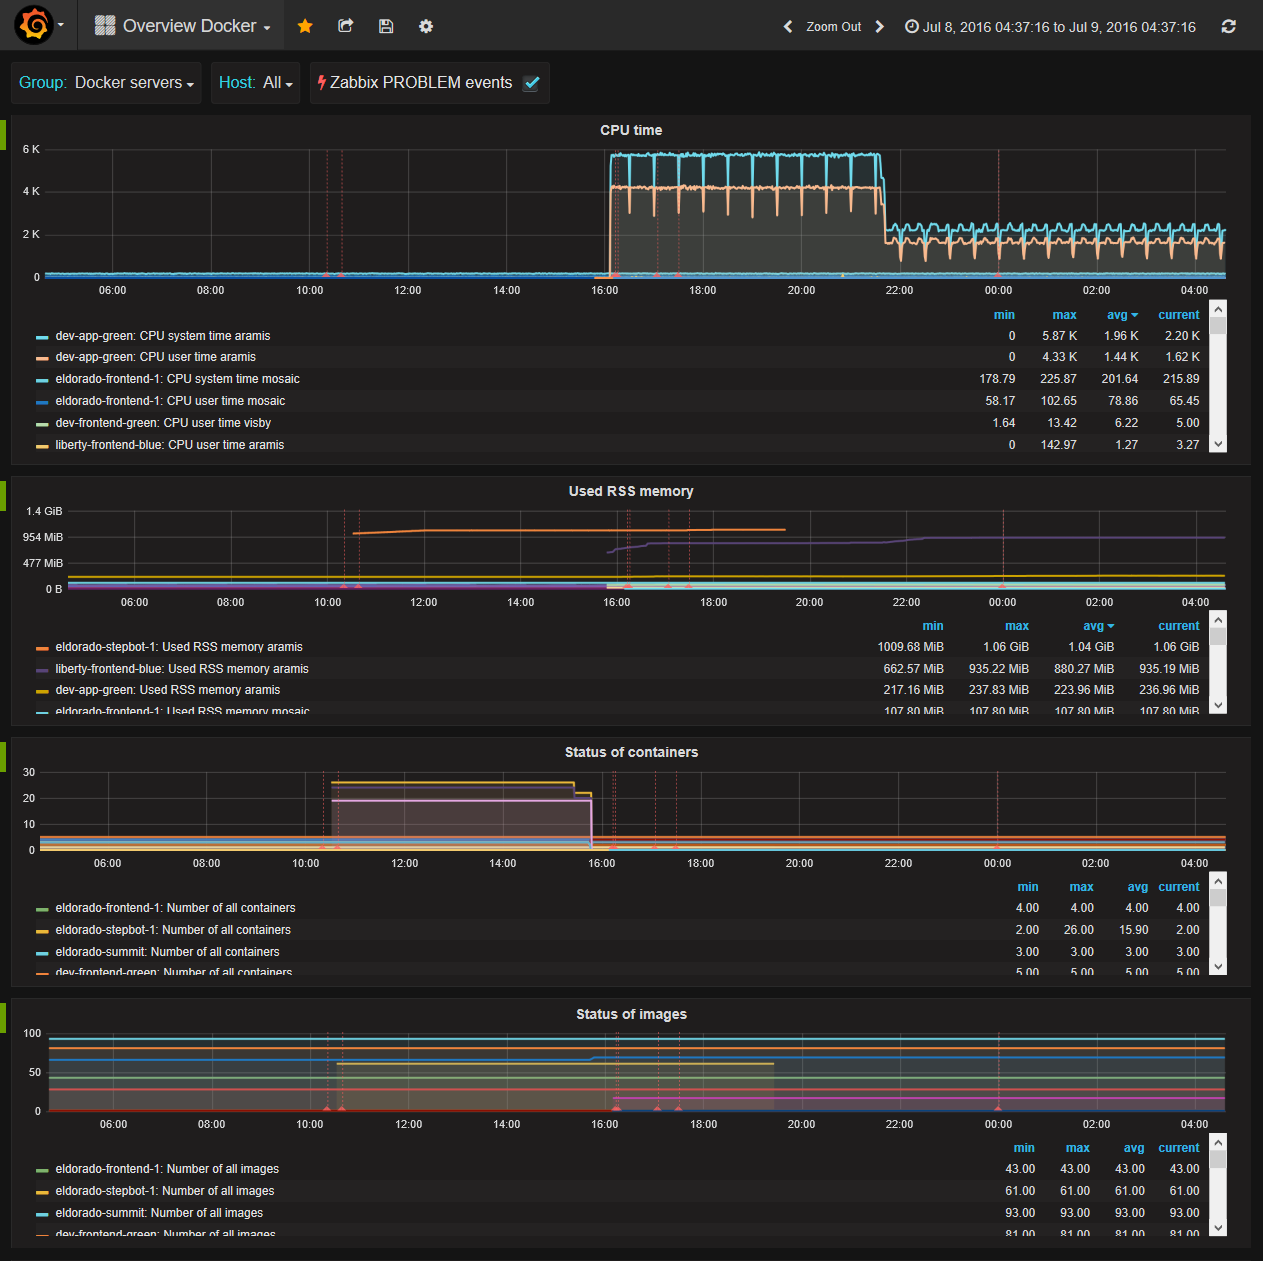
Requirement: https://github.com/monitoringartist/zabbix-docker-monitoring
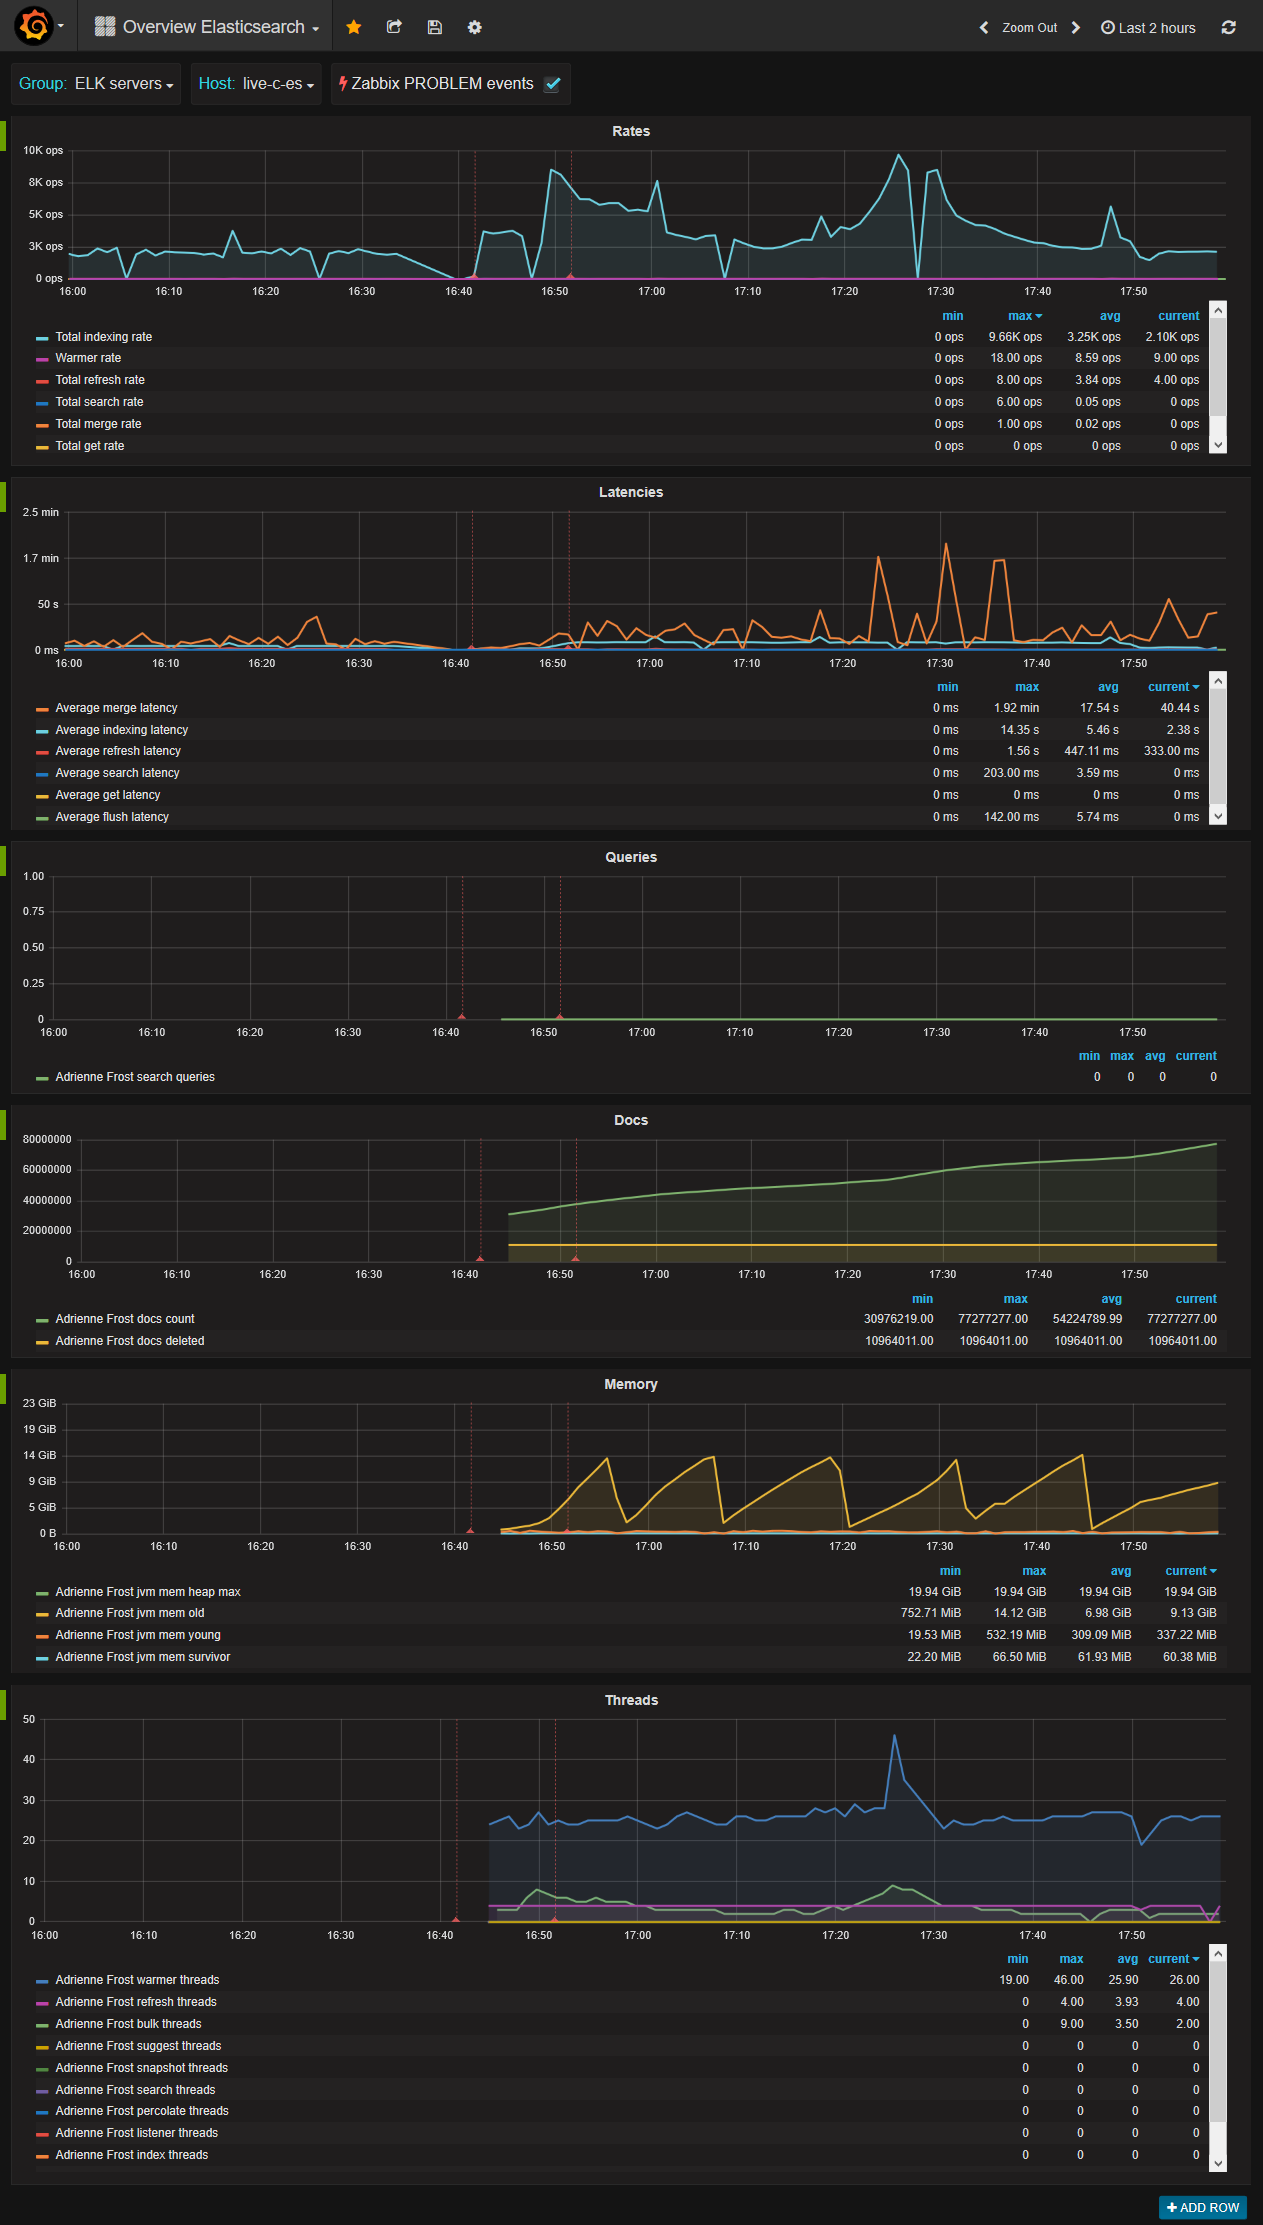
Requirement: https://github.com/mkhpalm/elastizabbix
Requirement: https://github.com/marcocaberletti/zabbix-plugins/tree/master/rabbitmq
Devops Monitoring Expert, who loves monitoring systems and cutting/bleeding edge technologies: Docker, Kubernetes, ECS, AWS, Google GCP, Terraform, Lambda, Zabbix, Grafana, Elasticsearch, Kibana, Prometheus, Sysdig, ...
Summary:
- 1000+ GitHub stars
- 6000+ Grafana dashboard downloads
- 800 000+ Docker image pulls
Professional devops / monitoring / consulting services: