Description
Environment
Version: v0.24.1 (note: we are using this version due to the Prometheus label issues in later versions)
OS: Ubuntu 16.04, 4.4.0-31-generic, x86_64
Docker: Docker version 1.12.6, build 78d1802
Containers: 4 (including cadvisor)
Cores: 2
Docker
Dockerfile:
FROM google/cadvisor:v0.24.1

ENTRYPOINT ["/usr/bin/cadvisor", "-logtostderr", "-profiling=true"]
Docker command:
docker run --volume=/:/rootfs:ro --volume=/var/run:/var/run:rw --volume=/sys:/sys:ro --volume=/var/lib/docker/:/var/lib/docker:ro --publish=8085:8080 --detach=true --name=test-cadvisor docker-registry:5000/test/test-cadvisor:latest
Problem
cAdvisor CPU usage is extremely high, such that it impacts the performance of the other containers. Typical CPU usage is between 20 - 110%, usually sitting at around 60-80%.
Output of the following profiling is attached:
go tool pprof -png -output=out.png http://localhost:8085/debug/pprof/profile
Note that I ran the profiling twice, just to compare results. I won't presume to interpret the results, other than to say that they look somewhat similarish, with a lot of time being spent in syscall.Syscall / syscall.Syscall6 as well as memory allocations and what I presume is garbage collection.
At first I thought it might be the same issue as #735 or kubernetes/kubernetes#23255 , but I haven't seen any invocations of du show up in the output of ps.
It's also interesting to note that we don't see this same CPU hit on all of our nodes. To date, we see it mostly on instances that are running containers that are using net=host and that spawn a significant number of process/threads within their containers. These containers wrap some legacy monolith applications that deviate from the "usual" operational model of web apps.


Activity
dashpole commentedon Nov 30, 2017
A number of performance tweaks have been made since then. From a quick scan, it looks like a large amount of that time is spent handling external requests. Might be worth measuring the number of requests cadvisor is serving, and seeing what its resource usage is when it is not handling any requests.
ZOXEXIVO commentedon Mar 17, 2018
Same issue: 8core x2 CPU with 9 running containers ~ CAdvisor take 13% of processor resources
schabrolles commentedon Apr 14, 2018
Same here: 1core VM with ~10 containers (running but doing nothing). CAdvisor takes 18% cpu.
elsbrock commentedon May 1, 2018
Same here. Lots of iowait. cadvisor USED mem (top) > 2G. Running
cAdvisor version v0.27.4 (492322b). Turned out there were too many open files.bmerry commentedon Jul 2, 2018
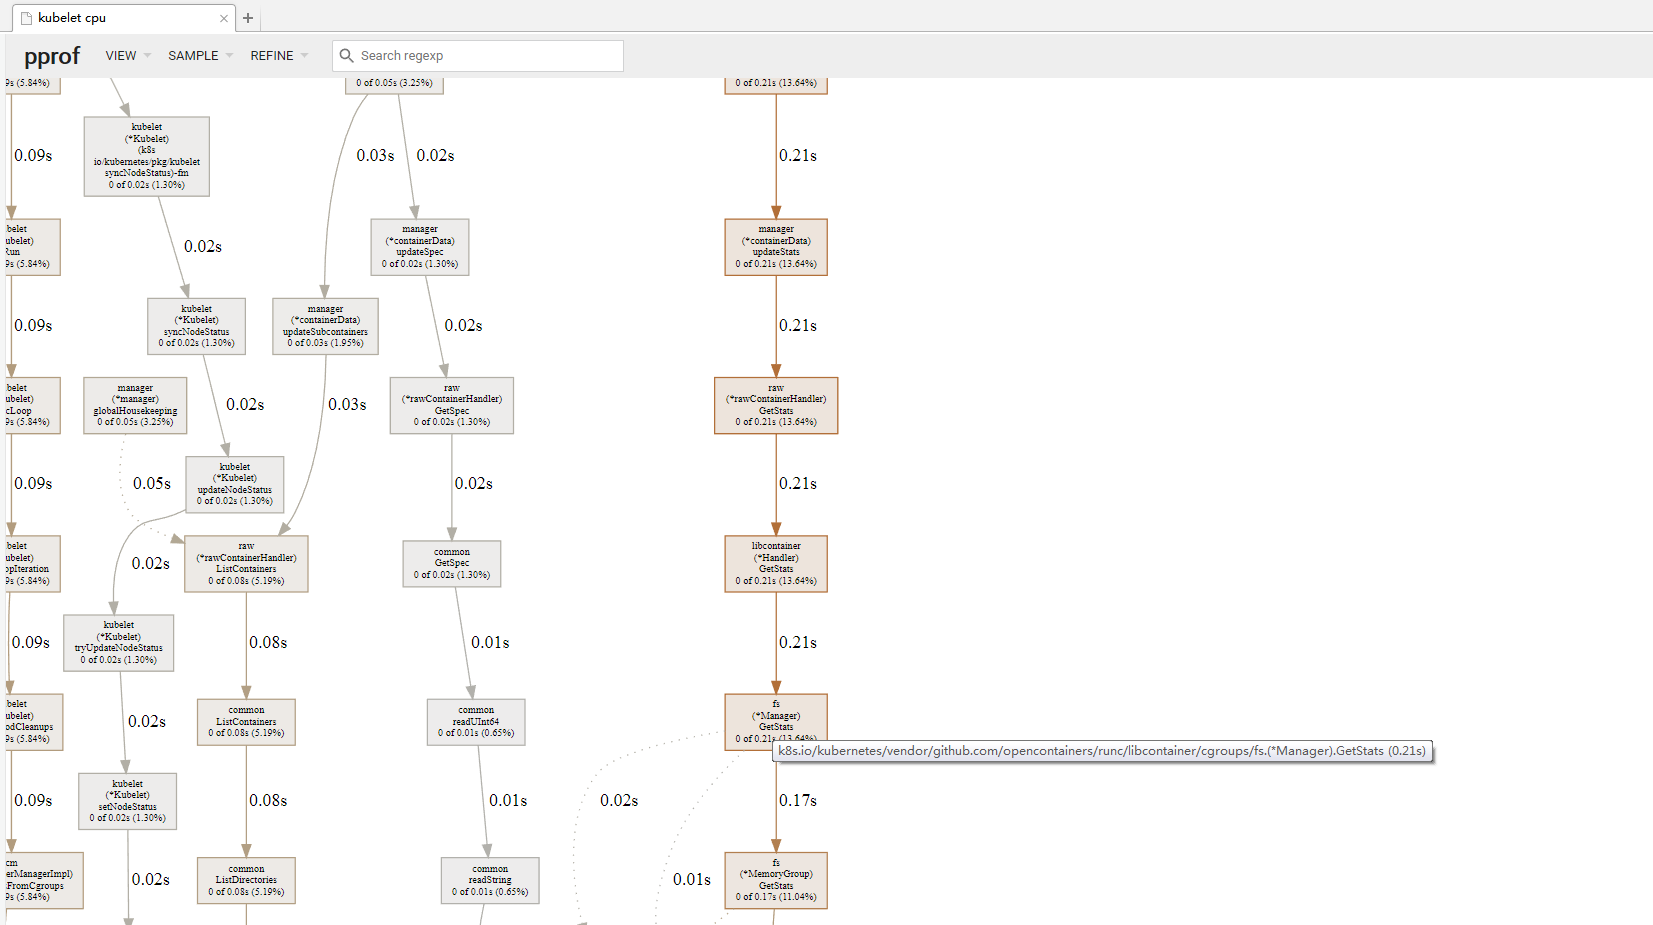
I'm seeing something similar (CPU usage consistently 30-70%). Profile below:

This profile is on a machine running only 12 containers, and we've seen it on machines with even fewer, but there doesn't seem to be a clear pattern. Restarting cadvisor doesn't resolve the problem, but rebooting the machine does. We have noticed that the affected machines have been gradually losing available memory over time, which /proc/meminfo shows is going into Slab memory, and slabtop shows the slab memory is about 80%+ dentry. We're not sure which direction the causality is i.e. whether cadvisor is hammering the FS and causing lots of dentries to be cached, or if something else on the machine is causing memory issues and that is making cadvisor CPU-heavy. The machine from which that profile was taken is also not showing the same memory leak, so it may be a red herring.
We're running cadvisor 0.29.0 with
/usr/local/bin/cadvisor --port 5003 --logtostderr=true. Some Docker info from the machine from which the profile was taken:dashpole commentedon Jul 2, 2018
@bmerry the graph you show looks like about what I would expect. Assuming your containers don't have anything in their r/w layer, most cpu usage generally comes from reading from cgroup files, of which there are many for the memory cgroup.
Not sure about the memory leak. I'm not super familiar with the cgroup implementation, but I know they aren't real files, and are "stored" at least partially in the dentry cache. Accessing cgroup files repeatedly should make the dentry cache grow, but it should be reclaimed when free memory gets low.
bmerry commentedon Jul 2, 2018
@dashpole thanks for taking a look. I've noticed that the pprof report claims ~4% CPU usage, which doesn't match what top reports (40%+). I've confirmed by taking another profile and the graph header reports ~4% while top showed 30%+ over the entire 30s. So there is something odd in the way the profiler is working - perhaps it only profiles user time? htop shows the CPU usage is mostly in the kernel.
Running perf top, the top hits are
which does seem to confirm your idea that it's related to cgroups.
The machine with the graph (using ~40% CPU) has 14669 files in /sys/fs/cgroup (counted with
find . | wc), while another machine using ~1% CPU has 9935. So the file count alone doesn't seem to explain the order-of-magnitude differences in CPU usage.FWIW, I've just tried with cadvisor 0.30.2 and
--disable_metrics=tcp,udp,disk,network- no improvement. Is there anything else I should try turning off?I'm hoping so - for now it's been "leaking" slowly enough that there hasn't been any memory pressure. On one machine the memory was in SUnreclaim rather than SReclaimable, but when I dropped the dentry cache manually the memory was returned.
bmerry commentedon Jul 2, 2018
It seems like it's definitely some slow path in the kernel. Simply
time cat /sys/fs/cgroup/memory/memory.stattakes 0.376s on the affected machine, and 0.002s on an unaffected machine. The affected machine has about 50% more cgroups, but that doesn't explain a >100x slowdown.That sounds more like a kernel issue than cadvisor's problem and if I get time I may try to take it up on the LKML, but if you have any suggestions on fixing or diagnosing it, I'll be happy to hear them.
This is probably a separate issue from the original report, where pprof showed high CPU usage. @ZOXEXIVO @schabrolles are you seeing the same behaviour I am?
bmerry commentedon Jul 19, 2018
After some discussions on the linux-mm mailing list and some tests, it sounds like the problem may be "zombie" cgroups: cgroups that have no processes and have been deleted but still have memory charged to them (in my case, from the dentry cache, but it could also be from page cache or tmpfs). These are still iterated over when computing the top-level memory stats. We had a service that was repeatedly failing and being restarted (by systemd), which probably churned through a lot of cgroups over a few weeks.
I still need to experiment with ways to fix the underlying problem (including checking if it is better in newer kernels), but I'd like to find out if there is a way to work around it. In particular, we tend to use it only to get per-Docker-container metrics into Prometheus, and not so much for aggregate or system metrics (we have node-exporter for that). So if there is a way we can turn off collection of
/sys/fs/cgroup/memory/memory.statsand/sys/fs/cgroup/memory/system.slice/memory.statswhile still collecting memory stats on individual Docker containers that would probably help.dashpole commentedon Jul 19, 2018
We don't have the option to disable collection of the root cgroup. We have an option --docker_only, but that keeps the root cgroup around.
bmerry commentedon Jul 19, 2018
Do you think that would be reasonably easy for someone not familiar with the code to implement as a command-line option, or is it pretty core?
dashpole commentedon Jul 19, 2018
I would rather not add a flag for that, but you can just remove the registration of the raw factory here: https://github.com/google/cadvisor/blob/master/manager/manager.go#L335, and that would turn off collection for all cgroups that are not containers. I am planning to introduce a command line flag to control which factories are used in the future, which should allow this behavior without rebuilding cAdvisor
bmerry commentedon Jul 26, 2018
That didn't work for me:
I also tried taking out the
/case in this line and running with--docker_only: it runs, but from strace I can see that it is still opening /sys/fs/cgroup/memory/memory.stat (as well as a bunch of cgroups under /sys/fs/cgroup/memory/system.slice, despite the--docker_only).20 remaining items
dashpole commentedon Jan 30, 2020
try using
--disable_metrics=sched,percpu,diskIO,disk,network,tcp,advtcp,udp,process, which includes all optional metrics.tmpjg commentedon Jan 31, 2020
@dashpole
same result with
--disable_metrics=sched,percpu,diskIO,disk,network,tcp,advtcp,udp,process:dashpole commentedon Jan 31, 2020
@tmpjg how many cores is your node?
tmpjg commentedon Jan 31, 2020
@dashpole 4 cores.
qingwave commentedon Feb 11, 2020
there is a dicussion about a cgroup bug, see Showing /sys/fs/cgroup/memory/memory.stat very slow on some machines, maybe useful for this issue
futianshi1314 commentedon Feb 29, 2020
centos: 4.4.180-2.el7.elrepo.x86_64
Kubernetes v1.12.3
the kubelet high cpu, pprof cadvisor used cpu time long ,cost systemcall get cgroup mem
futianshi1314 commentedon Feb 29, 2020
@theojulienne @bmerry
Hi, I have the same issure,
CentOS Linux release 7.6.1810 (Core)
kernel:4.4.180-2.el7.elrepo.x86_64
Kubernetes v1.12.3
but echo 2 > /proc/sys/vm/drop_caches will without stop, and cpu load high,too many "kworker" kernel processing, which kernal version can use echo 2 drop_caches? I will reinstall the system.thanks
theojulienne commentedon Feb 29, 2020
I would suggest either upgrading to a newer kernel or disabling the code that is polling this stat file if that's not an option.
There's some more details of this from the kernel side from the RHEL folks here, which has a nice summary of the patches and trace scripts: https://bugzilla.redhat.com/show_bug.cgi?id=1795049
The
bpftracescript they used to check for this also got published which might be useful for folks wanting to determine if this is the issue they are observing.futianshi1314 commentedon Mar 1, 2020
@theojulienne OK , I'll try it later and get back to you soon .Thanks
fengpeiyuan commentedon Aug 24, 2020
bugfix kernel release version can click https://bugzilla.redhat.com/show_bug.cgi?id=1795049
mikedanese commentedon Oct 8, 2020
Performance of memory.stat was improved in https://spinics.net/lists/cgroups/msg21876.html
9Mad-Max5 commentedon Jan 11, 2022
Hi,
I'm having similar issues, with close to 30% precent of CPU usage running cadvisor on a QNAP NAS.

I think I tried everything I found to tackle this issue but without any solid result.
It cost me a lot of nerves to get the out.png from my server, as the native support isn't that good.
Could anybody tell me with this picture what is going wrong?
linfangrong commentedon Mar 13, 2025
--housekeeping_interval=15s