DiVenn has been transferred to https://divenn.tch.harvard.edu
DiVenn is an interactive and integrated web-based tool for comparing gene lists
Sun, Liang, et al. "DiVenn: An Interactive and Integrated Web-based Visualization Tool for Comparing Gene Lists." Frontiers in Genetics (2019),doi: 10.3389/fgene.2019.00421
- Liang Sun: sunliang@udel.edu
- Yinbing Ge: yinge@noble.org
- Zach Robinson: ztrobinson@noble.org
- Xueqiong Li: xli@noble.org
If you have any questions, please contact Liang Sun: sunliang@udel.edu
Click below to watch a tutorial video.
Gene expression data generated from multiple biological states (mutant sample, double mutant sample and wild-type samples) are often compared via Venn diagram tools. It is of great interest to know the expression pattern between overlapping genes and their associated gene pathways or gene ontology terms. We developed DiVenn – a novel web-based tool that compares gene lists from multiple RNA-Seq experiments in a force directed graph, which shows the gene regulation levels for each gene and integrated KEGG pathway and gene ontology (GO) knowledge for the data visualization.
- Informative force-directed graph with gene expression levels to compare multiple data sets;
- Interactive visualization with biological annotations and integrated pathway and GO databases, which can be used to subset or highlight gene nodes to pathway or GO terms of interest in the graph;
- High resolution image and gene-associated information export.
The current version is “2.0”.
The application is freely available at https://divenn.tch.harvard.edu/ (see Figure 1).
 Figure 1. Homepage of DiVenn
All modern browsers, such as Safari, Google Chrome, and IE are supported. The recommended web browser is Chrome.
DiVenn currently accepts two types of input data (see Figure 2):
- Two-column tab separated custom data. For example, gene ID and corresponding pathway data, transcription factors and their regulated downstream genes, and microRNAs and corresponding target genes. The second column must be "1" or "2". Note: the comparison name by default is "Exp_0". You can have your own comparison name but the name cannot start with a number.
- Gene expression data. The first column is gene IDs and the second column is gene regulation value. The gene regulation value should be obtained from differentially expressed (DE) genes. Users can select the cut-off value of fold change (for example, two-fold change) to define their DE genes. To simplify this gene regulation value, we require users to use “1” to represent up-regulated genes and “2” to represent down-regulated genes based on their own cut-off value of fold change. If users need to link their genes to the KEGG pathway (Kanehisa and Goto, 2000) or GO database, 14 model species are supported in DiVenn. Currently, three types of gene IDs : KEGG, Uniprot (UniProt, 2008) and NCBI (Benson, et al., 2018), are accepted for pathway analysis. All agriGO (Du, et al., 2010; Tian, et al., 2017) supported IDs are supported for GO analysis by DiVenn (View table or download in Excel).
Please use the following sample data to test our tool: https://divenn.tch.harvard.edu/data.html

Figure 2 Flow chart of DiVenn

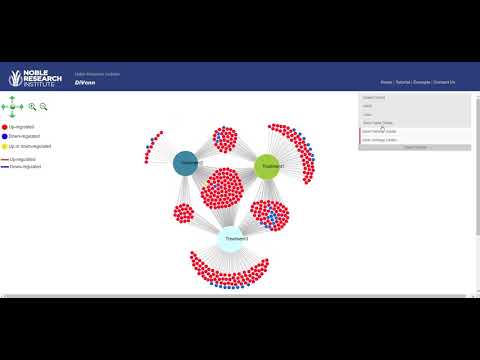
Figure 3 Force-directed graph in DiVenn
Scrolling with the mouse wheel on the graph will zoom into/out of the graph.
Left-clicking a node will show the connected edge colors, which will display the gene regulation status for each experiment. Double-clicking the same node will hide the connecting edge colors.
Right-clicking a node will show five function options: show or hide one or all node labels, show all gene associated pathways, or GO terms.
Right-clicking nodes can show the gene IDs of interest (see Figure 4).
If users need to check the KEGG pathway or GO terms of interested gene node, they can choose the ‘Gene details’ option after right clicking the node (see Figure 5).

Figure 4 Right-click functions. Gene node names can be displayed and hidden; the detailed gene function, including pathway and GO terms, can be displayed through ‘Gene details’ button.

Figure 5 Gene details. KEGG pathway and GO terms will be displayed.
You can hide or show node labels.
You can change the color of all parent/experiment nodes in GUI (see Figure 3).
Graph can be saved as an SVG image file via the "Save as SVG" function, and the SVG file can be downloaded to your local computer. This SVG file can be converted to a high-resolution image using free online tools.
You can show all gene-associated pathways by clicking this button and get the pathway informative table (see Figure 6).
The column headers on the informative table are sortable; the table is also searchable with key words of interest. If users need to sort a gene list based on the pathway name, they can click on the “Pathway” column header. If users need to select multiple genes from the same pathway after sorting the genes based on pathway, they can click the first checkbox and press shift before clicking the last checkbox. They can redraw the selected genes to the square shapes by clicking the “Redraw” button at the end of the table or subset the genes into another new graph by clicking the “Only Redraw Selected” checkbox and the “Redraw” button. For example, we can select all genes which are enriched to a significant KEGG pathway “Plant-pathogen interaction” (p value = 7.83e-14) and highlight all genes to be square shapes via “Redraw” function (See Figure 7). We can also subset all genes which belong to KEGG pathway “Plant-pathogen interaction” into another new graph (See Figure 8).
 Figure 6 Pathway details of all associated genes in the force-directed graph.
 Figure 7 Highlight of genes in KEGG Plant-pathogen interaction pathway (square node).
 Figure 8 Subset of genes belonging to KEGG Plant-pathogen interaction pathway.
You can show all gene-associated gene ontologies by clicking this button to get the gene ontology informative table (see Figure 9).
The column headers on the informative table are sortable; the table is also searchable with key words of interest. If you need to sort the gene list based on the gene ontology name, click on the “GO term” column header. If you need to select multiple genes from the same GO terms after sorting the genes based on GO terms, click the first checkbox and press shift before clicking the last checkbox. You can redraw the selected genes to the square shapes by clicking the “Redraw” button at the end of the table or subset the genes into another new graph by clicking the “Only Redraw Selected” checkbox and the “Redraw” button.
 Figure 9 Gene ontology details of all associated genes in the force-directed graph.
Visualization tools D3.js and a lightweight graphical user interface dat.GUI